This chapter has been excerpted from the book "Flow-Based Programming: A New Approach to Application Development" (van Nostrand Reinhold, 1994), by J.Paul Morrison. A second edition (2010) is now available from CreateSpace eStore and Amazon.com. The 2nd edition is also available in e-book format from Kindle (Kindle format) and Lulu (epub format). To find out more about FBP, click on FBP.
For definitions of FBP terms, see Glossary.
|
[Since the book "Flow-Based Programming" was written, a Java version of FBP has been built, now called JavaFBP. The code specifying a JavaFBP network is described in JavaFBP Network Definitions. This is an example of what might be called a "procedural" specification, and is similar to that used by a number of the systems mentioned in Cognates, such as NIL, developed by Rob Strom and his team at IBM. Although a network diagram can be converted fairly easily into such a specification, they are not easy to grasp directly - but then that is probably true even for the notations shown below when they become fairly large! The real answer, as always, is a multi-level diagram, supporting step-wise decomposition - see DrawFBP.]
Material from book starts here:
FBP applications start off life as pictures or hierarchies of pictures, which have to be made "machinable" for execution. During most of our twenty years [as of 1994] of experience with FBP, we have never had advanced picture-drawing tools, so we tended to draw networks using pencil and paper, and then convert them by hand into executable networks. Although we have experimented with different notations over the years, the information which needs to be captured has remained fairly constant. It is certainly true that FBP lends itself to visual programming techniques, so what I am going to describe will become less important as time goes on, but, for now, we still have to have notations which allow networks to be input directly into the machine.
The diagrams typically used for Structured Analysis represent processes and their connections. To turn such a diagram into an FBP diagram, which can actually be executed, you only have to add the following data:
-
port names (or numbers)
-
parametrization
-
automatic ports
For ease of understanding, you could always add the following to Structured Analysis diagrams:
-
stream descriptions
-
process descriptions (e.g. "merge masters and details")
-
icons for external objects, users, etc.
The same is true for FBP diagrams. Since we have mostly used pencil and paper, we never really worried too much about the exact diagramming conventions to be used. In fact, if some Structured Analysis diagramming convention is in use in a given shop, it makes sense to just expand on whatever convention was used for analysis.
Clearly there is a great opportunity for powerful picture-drawing tools to assist in the design and development process. It would be nice to be able to "explode" a process and see its structure at the next lower level [DrawFBP, described elsewhere on this web site, supports this], or look at a connection and see the data stream that passes over it. When building networks, it would be even nicer to be able to pick up an icon for, say, Collate, and place it on the diagram, complete with "sticky" ports ready to be connected to its neighbours.
We have drawn a number of pictures in what has gone before, but we have yet to talk about how we get these into the machine to be executed.
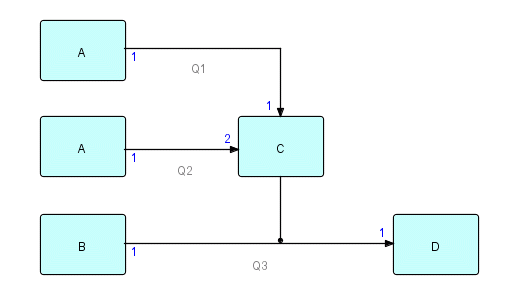
The very first FBP software, AMPS, was written in IBM S/360 Assembler language, and networks were also expressed using Assembler macros. Each process was specified using a single macro call, which also listed the named connections between that process and the other ones. In what follows, I will use a simple network and show how it was specified to the system in the various FBP dialects. Let us take as our sample network the following:
Figure 23.1
In AMPS and DFDM ports are specified numerically, so I have marked the ports as numbers in this diagram. (In DFDM input and output ports were numbered separately, while in AMPS one set of numbers covered both - this diagram follows the DFDM convention).
In AMPS this would have been specified approximately as follows (we will use PROCESS rather than the actual macro name used, to show the analogies with present-day terminology):
     PROCESS PROG=A,AQ=Q1
     PROCESS PROG=A,AQ=Q2
     PROCESS PROG=B,AQ=Q3
     PROCESS PROG=C,Q=(Q1,Q2),AQ=Q3
     PROCESS PROG=D,Q=Q3
Figure 23.2
where the PROCESS macro shows a process, Q= lists the queues inputting to the process (feeding the process), and AQ lists the queues fed by the process. Communication between processes is thus set up by naming the connections (called "queues" in AMPS). [There is no other reason to name connections.] Numbering is sequential, starting with Q= and then going on through AQ=. Parameters could also be specified in the network, and were added using PARM= as an address-type parameter on the PROCESS macro, when required. As each macro describes a separate process, there is no need to distinguish between different uses of the same component (indicated by the PROG= parameter).
Notice a concept common to all the varieties of FBP: when more than one output port is connected to one input port, it is treated as one connection (queue). Connections can be many-to-one, but not one-to-many.
Parameters in AMPS were more general than DFDM's: an AMPS parameter could be a data structure of any form, while DFDM parameters were always variable length character strings - DFDM's were consistent with the format of parameters passed to a job step by the MVS operating system.
DFDM has two different notations: interpreted, which is used to build the network dynamically at run-time, and compiled, where the control blocks for the network are built as a single Assembler program, which when compiled and link-edited results in a ready-to-run network control block structure. The interpreted notation allows a program to be modified and tested many times during a session. Test components can also be added easily to monitor the contents of connections or to create test data. The compiled format does not have the interpretation overhead, but takes a little longer to generate, so is more appropriate when a network is put into production or you want to study a program's performance. Once you are ready to go from interpreted to compiled format, you use a utility program (called "Expand") to do the conversion. The other main difference is that, in the interpreted case, components are loaded dynamically at run-time, while in the compiled case all the components are linked together, along with the network, into a single load module [a single executable block of code, rather like a present-day .exe file] .
Both of these DFDM notations are based on specifying a list of connections, rather than processes. These connections specify the processes which they connect, but are themselves unnamed. Processes are named by component name, plus an optional qualifier, where a qualifier is indicated by a period. The interpreted notation uses arrows (->) (originally also ampersands (&)) to indicate connections. Port numbers are shown before and after the connection mark (if not specified, the default is 1). Connections can be strung together in "paths", with a comma marking the end of a path. Earlier versions of DFDM did not mark the end of a network, but the Japanese version used a semi-colon. So the above diagram in DFDM interpreted notation would read as follows (since in DFDM input and output ports are numbered separately, C has input ports 1 and 2, and output port 1):
A -> C -> D,
A.X -> 2 C,
B -> D;
Figure 23.3
where we have distinguished the second occurrence of A with the qualifier X (any character string would have done).
The corresponding compiled specification would then be:
X     NETWORK
      CONNECT A,C
      CONNECT C,D
      CONNECT A.X,(2,C)
      CONNECT B,D
      NETEND
      END
Figure 23.4
As can be seen, both notations use the same qualifier notation.
One other major difference between the interpreted and compiled notations of DFDM is that the interpreted notation is hierarchical, whereas the compiled is "flat" (it is "flattened" when it is expanded, so that the whole network becomes a single module). In the interpreted notation, you can define a subnet, call it G, with "sticky" connections, e.g.
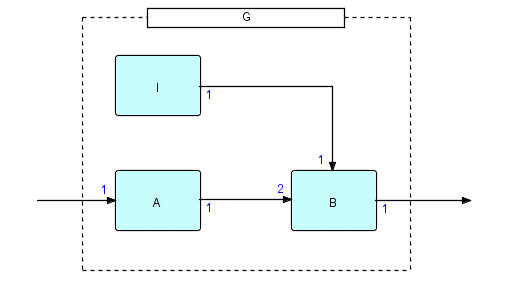
G: -> A -> 2 B ->, I -> B
Figure 23.5
would mean that G has one input port and one output port which will be connected when G is used. Arrows with an open end are the external interfaces of the subnet, in this example, the arrow feeding A and the arrow coming from B.
G's picture therefore looks like this:
Figure 23.6
G has two external ports: one input and one output. These are the arrows which cross the "boundary" of G (shown as a dotted line). G can therefore be used as an ordinary filter in a network, and, like all components, can be used more than once in a network.
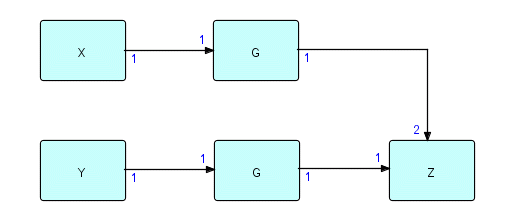
Here is a network which uses G:
Figure 23.7
This might be coded as follows in the interpreted notation:
     X -> G -> 2 Z,
     Y -> G.2 -> Z
Figure 23.8
Note that composite components can be qualified just like elementary components - at this level, the network doesn't know that G even is a composite. If this network is then expanded to form a single flattened network, you will see two instances each of I, A and B, as follows:
X     NETWORK
      CONNECT X,A.1
      CONNECT I.1,B.1
      CONNECT A.1,(2,B.1)
      CONNECT B.1,(2,Z)
      CONNECT Y,A.2
      CONNECT I.2,B.2
      CONNECT A.2,(2,B.2)
      CONNECT B.2,Z
      NETEND
      END
Figure 23.9
The Expand function automatically assigns qualifiers to all the resulting processes. Composite components like G can be coded in the same file or file member as the network which references them or in a separate file or file member.
When the network using G is expanded, you see that G loses its identity and merely becomes a pattern within the total network. Since I has no inputs, and G has lost its identity at run-time, all the I's will start up at start of run.
One other thing to notice is that the expanded list is not very easy to grasp. People generally find that it is easier to work with the interpreted form for two reasons: you can see the effect of a modification immediately, and also an individual network or subnet is easier to understand when it has no more than about 7 processes (human short-term memory seems to be able to handle 7 plus or minus 2 objects), so you can build up quite complex applications, as long as they are built up out of layers none of which exceed more than about 7 processes. Ideally of course this should be done using a graphic interface, but we did not have such tools available.
In the experimental THREADS system mentioned above [the C implementation of FBP concepts], we have both an interpreted and a compiled network specification. Here is a rather trivial example of a THREADS network in the interpreted notation to illustrate some of its features:
'data.fil' ->
    OPT Reader(THFILERD) OUT ->
    IN Selector(THSPLIT) MATCH ->
    IN Replicate(THREPL) OUT[0] ->
    IN Display(THVIEW),
    Replicate OUT[1] -> IN Display,
   '11,2,0' -> OPT Selector;
Figure 23.10
This represents the following network:
Figure 23.11
The above notation follows DFDM in that you trace a path until you hit a dead end, insert a comma and then start on the next path, and so on until the whole network is specified.
Where DFDM named processes by giving a component name plus qualifier, THREADS names processes directly, and attaches a component name in brackets to one of the occurrences of the process name. Ports are named, rather than numbered, so the notation for a connection is:
... process-name port-name -> port-name process-name ...
Figure 23.12
As befits the "C" basis of THREADS, elements of array-type ports are identified by
port-name [ element-number ]
Figure 23.13
numbering up from zero.
The end of a network is marked with a semi-colon.
The other major way in which THREADS differs from AMPS and DFDM is its concept of Initial Information Packets (IIPs). These are shown as quoted strings followed by arrows (indicating that these are really a special form of connection), e.g.
'data.fil' -> OPT Reader(PROCR) ....
Figure 23.14
This attaches the string "data.fil" to port OPT of Reader in such a way that when Reader does a receive from its OPT port, the string is turned into a "real" IP and becomes accessible to Reader's code. After processing, Reader has to dispose of it as usual. If Reader does a receive from that port again, it will receive an "end of data" indication.
Automatic ports can be specified by putting an asterisk in place of a port name.
You can also specify subnets following the main network in the same file, or as separate files, which are started with a label (symbol followed by a colon) and terminated with a semi-colon. Here is an example of a THREADS network definition together with some subnets:
'data.fil' -> OPT reader(R1) OUT ->
  IN  thcount(THCOUNT) COUNT ->
  MIN display(C1),
  'H' -> MOPT display;

C1:
 MIN => IN process_C(THVIEW),
 MOPT => OPT process_C OUT => MOUT;

R1:
OPT => OPT reader(THFILERD) OUT => OUT;
Figure 23.15
Process names only have to be unique within a given subnet, so the two uses of Reader do not conflict. You will also notice that the port names on the subnets are identified with the corresponding internal ports by means of an arrow-like equals sign (=>). This is to stress the fact that these are not really connections, but are more like equivalences. In both DFDM and THREADS, a subnet may specify ports which are not used in the network referencing it, but the reverse situation is not allowed (if a port is referenced at a higher level, it must be specified in the definition of the subnet).
THREADS also has a compiled format - it differs from DFDM in that it does not generate the control blocks directly, but is still a list of the connections, in fixed format rather than in free form. The advantage of this is that we can change the implementation of the THREADS Driver and the format of its control blocks, without the user having to recompile all of his or her applications.
I have gone into some detail on the various approaches to notations because, for many jobs, the network notation is all the code a programmer ever has to write! Whether we name the connections or the processes, all we are really doing is telling the machine about a list of connections. As such, sequence really doesn't matter, so, even if you feel this should be called a programming language, it is definitely a non-sequential one! It also has a natural relationship with pictures, so in the future we hope there will be graphical tools which will make entry of this information into the machine even easier. [Such a tool has since been developed - called DrawFBP - and is described in Appendix D, recently added to the online version of the book.] For debugging conventional languages, we are just starting to get packages which allow the developer to walk through a program interactively - a graphical aid to debugging FBP networks should allow you to monitor the data passing across a connection, or track a single IP as it travels through the whole network and observe its transformations. As with any debugging tool, the real challenge is to provide ways for the developer to build mental models, both of the program the way it should be working, and also of how it is going wrong.


