This chapter has been excerpted from the book "Flow-Based Programming: A New Approach to Application Development" (van Nostrand Reinhold, 1994), by J.Paul Morrison. A second edition (2010) is now available from CreateSpace eStore and Amazon.com. The 2nd edition is also available in e-book format from Kindle (Kindle format) and Lulu (epub format). To find out more about FBP, click on FBP.
For definitions of FBP terms, see Glossary.
|
Material from book starts here:
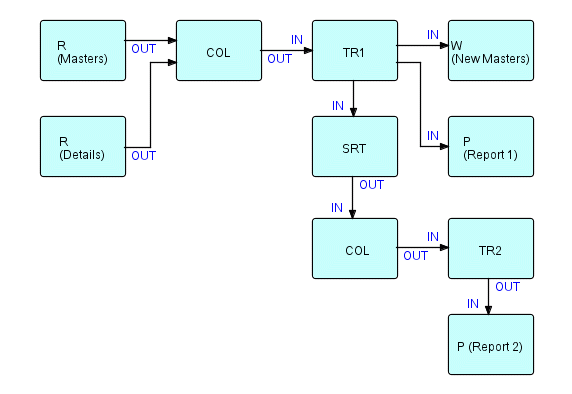
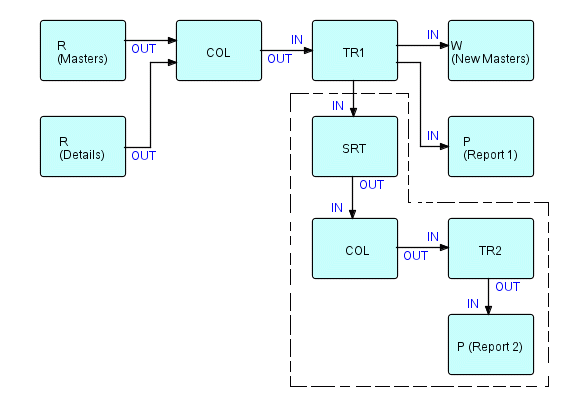
In this chapter, we will be working with a more complex example, the Sales Statistics application described in (Leavenworth 1977). The referenced paper describes an application in which a sorted detail file of product sales is run against a product master file, producing an updated master file and two reports: a summary by product and a summary by district and salesman. The figure on the next page, which originally appeared in (Morrison 1978), shows the FBP process network for this application.
In the conventional approach to building this application, we would first split off the district/salesman summary into a separate job step preceded by a Sort. This leaves us with a function which accepts two input files and generates three outputs (updated master, product summary and Sort input, also referred to as extended details). This function must pass details against masters, take care of the fact that one of the files will usually terminate before the other, handle control breaks, detect out-of-sequence conditions, etc., etc.
As we said in the previous chapter, the Collate component is key to simplifying this kind of application. The resultant diagram looks like this:
Figure 10.1
where
-
R is a Read component.
-
W is a Write component.
-
COL is a generalized Collate which merges two or more streams on the basis of specified control fields and inserts bracket IPs between IPs with different control field values. (If used with only one stream, it simply inserts bracket IPs - this is the case in the second occurrence of COL).
-
P is a Print component.
-
TR1 and TR2 correspond to Tran-1 and Tran-2, respectively, in B. Leavenworth's paper
-
SRT is a generalized "Sort" component which sorts the Extended Details coming out of Tran-1, by Salesman within District.
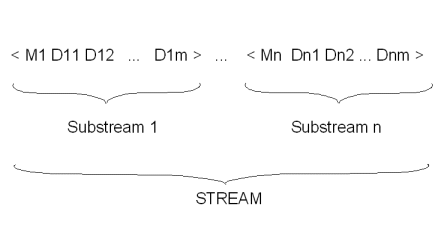
The output of the Collate component consists of sequences of groups, called "substreams", each consisting of an open bracket, a master, zero or more details, and a close bracket.
This can be shown schematically as follows:
Figure 10.2
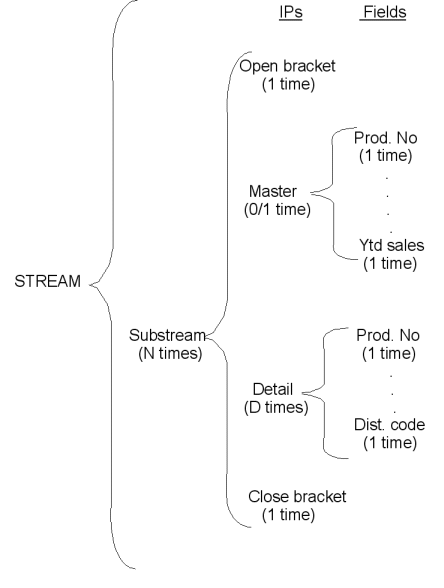
J-D. Warnier (1974) uses a vertical form of the above diagram to define the input and output files of an application, and uses this to determine the structure of the code which has to process them. Unfortunately, control flow programming requires that one of the files has to become the driver in terms of the overall program structure, so that, if there are any significant differences between the structures of the different files, the program structure becomes less and less easy to derive and understand, and hence to maintain. In FBP, this structure tells us important things about just those components which receive or send this particular stream structure, so it remains an extremely useful device for understanding the logic of the application.
The input stream for TR1 is shown as it might be expressed using an extension of J-D Warnier's notation:
Figure 10.3
Of course, in Warnier's book, the above type of diagram is used to describe actual files, rather than FBP streams, but I believe it generalizes quite nicely to IPs, substreams and streams. The last column, of course, is fields within IPs.
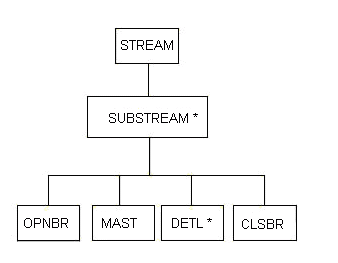
Another methodology with close affinities to Warnier's is the Jackson methodology, already alluded to. He uses a horizontal version of this notation, using asterisks to indicate repeating items. Using his notation, this diagram might look as follows:
Figure 10.4
Now, going back to our example, TR1 generates three output streams - one consisting of updated master records, one of summary records, which are similar to masters but have a different format (they are intended for a report-printing component), and one of "extended" details: detail records with an "extended price" field (quantity times unit price) added.
The following computations must be performed:
extended price (in detail):=
	quantity from detail * unit price from corresponding
	    master record

product total (in summary):=
	sum of extended prices over the details relating
	   to one product master

year-to-date sales (in summary and updated master):=

	year-to-date sales from incoming master record +
  	   product total
Figure 10.5
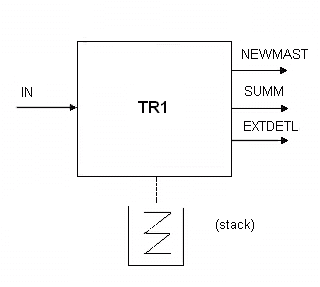
We have talked above about using non-loopers with stacks to handle nested streams and substreams. If we add a stack to our TR1 components, we get the following "blown up" picture of TR1 (the stack is not shown in a network definition - I just show it because it is "external" to the process):
Figure 10.6
Here is the logic that needs to be performed for each incoming IP (as you can see, it is very similar to the logic we showed in the previous chapter):
-
At "open bracket time",
-
create a control IP
-
clear the total quantity field in this new IP
-
store the IP in the stack
-
-
At "master time",
-
obtain the control IP from the stack
-
copy the information from the incoming master into the control IP, such as unit price, year-to-date sales, etc.
-
discard the master IP
-
replace the control IP in the stack (you have to remove an IP from the stack before it can be processed)
-
-
At "detail time",
-
obtain the control IP from the stack
-
update the total quantity by the quantity in the detail IP
-
calculate an extended price for the detail
-
put out the extended detail to its own output port
-
return the control IP to the stack
-
-
At "close bracket time",
-
obtain the control IP from the stack
-
create a summary
-
calculate the product total (dollars)
-
format the summary IP and put out to the summary port
-
create a master IP with the information from the control IP, and put to the "updated master" output port
-
discard the control IP
-
the stack is now empty, so that when the next open bracket arrives, a new control IP can be "pushed" onto the stack, preserving the stack depth
-
-
At end of data,
-
the process closes down, resulting in its output ports being closed, which in turn allows its downstream processes to start their own close-down procedures.
-
Note that summary and updated master IPs are not output until "close bracket time", as all the details for a given master have to be processed first.
FBP is chiefly concerned with dynamic IPs, rather than with variables. Although it might at first glance seem that this would result in undisciplined use and modification of data, in fact we have better control of data because each IP is individually tracked from the moment of creation to the time it is finally destroyed, and it cannot simply disappear, or be duplicated without some component issuing a specific command to do this. During an IP's transit through the system, it can only be owned by one process at a time, so there is no possibility of two processes modifying one IP at the same time. We in fact monitor this at execution time, by marking an IP with the ID of its owning process: the act of getting addressability to an IP, if successful, confers "ownership" of that IP on the process doing it.
In fact, in this example almost all modifiable data is in IPs, and there is no global data at all. FBP did not require a global facility during its earlier years, and, although it has been added to some dialects of FBP, it is still only used very occasionally.
We can also use Figure 10.1 to illustrate how easy it is to modify
this
kind of network, whether it is to satisfy business requirements,
improve
performance, or for whatever reason. Here is what I said in my article
(Morrison
1978) about how this diagram might be modified (this article uses the
term
DSLM for the cluster of concepts which we now call FBP):
"A valid objection can be raised that sorting is just one way of arranging information into a desired sequence, and that the decision as to the exact technique should not be made too early. The point is that DSLM allows the designer to concentrate on the flow of data and in fact makes the available options more visible and more controllable. For instance, in the above example the designer may decide that, for various reasons, he prefers to construct a table of district and salesman codes and totals, which will be updated randomly as the extended details come out of TR1."
I apologize for the use of "he" and "salesman", but this was 15 years ago [when the book was written - 1994]! I then went on to suggest that the subnet demarcated by the dots in the diagram below could be replaced by a network which updates totals at random, then signals a scan and report function to display the resulting totals, i.e.
Figure 10.7
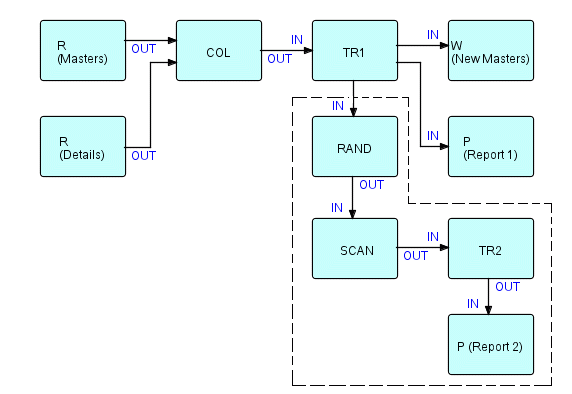
could be modified as follows:
Figure 10.8
where RAND is a component which updates totals in a table at random, while SCAN goes through all the totals at end of job, generating report lines.
How does SCAN get triggered and, once triggered, how does it get access to the table which has been built by RAND? Well, since, in FBP, all that moves through connections are the handles for IPs, why not have RAND just "send" the whole table? This ensures that SCAN doesn't start until RAND has finished, plus it takes care of SCAN getting addressability to the table - at the right time! In conventional programming, tables don't move around - and, in fact, in FBP they don't either, but it is very convenient to make them appear to!
I mentioned a "report generation" component above. You will find this essential for your batch business applications, and it illustrates the power of FBP and also FBP's ability to help you divide function into manageable components. For almost all business applications we found that we needed a component which would accept formatted lines and combine them into report pages. An upstream process can have the job of generating the formatted lines, and this type of function should be kept separate from page formatting. FBP is a "black box" reuse tool, and in fact your Report Generator component can be used as a black box by your applications. As such, it can implement the standards for reports in your installation, and it can make it easier for programmers to conform to your standards by making it less work (definitely the best way to encourage adherence to standards)! So far, so good. However, every shop has a different report standard, so you will have to build your own black box to embody your own standards. Luckily it is easy to build new components using the FBP API calls. If we decide that we want to distribute this kind of component more widely, it seems to call for a different distribution technique: either in source format, or implemented as a pure black box, but with installation-provided exits, or as a black box supporting a mini-language. Perhaps we should call this a "grey box".
Here is a list of the facilities we provided in the Report Generator we used with DFDM in our shop:
-
accept two lines of permanent title information as run-time options, and combine these with date information in an installation-standard format
-
accept two dates for the run: the actual date and the effective date ("as of" date)
-
accept additional title information from an additional IP stream which could be changed dynamically (on receipt of a "change title" signal)
-
generate page numbers
-
accept a signal to reset the page number
-
generate an "end of report" box at the end of the report (this lets the human receiving the report know it is complete)
-
generate a "report aborted" box on the report on demand
-
support all of the above features in English, French or bilingual English and French (under control of an option).
This may seem like a long list, but it basically embodied a preexisting set of shop standards, some of which were supported by subroutines, but some weren't. Now, instead of having to mandate a standard which people see as extra work, we had a component which did it "automatically". In our experience, it is much easier to enforce a standard which saves people work. If they use your component, their reports will follow shop standards, and your systems will also be more reliable and cheaper to build and maintain. You can tell your developers, "We don't mind if you don't follow standards, but it'll cost you, and, if you miss your deadlines, we'll be asking for an explanation!". The same philosophy was followed in the early days of hardware development. Designers were perfectly free to create new components, but they had to carry the whole cost of development, testing, etc., themselves. Today, it is no coincidence that the vast majority of personal computers are built around a very small number of different CPU chips. This is a variant of a point we will come back to often - only by changing the economics of application development will we get the kind of behaviour we are trying to encourage.
One last point may appear obvious at first: this Report Generator assumes that its input IPs are fully formatted report lines. Formatting of these report lines may logically be split off into separate components. Now, programmers rooted in conventional programming may feel that such rigid separation is not possible, but they have not had the experience of using a separate component which makes such separation attractive economically, as well as logically. Once such a thing exists, people find that they can make intelligent decisions balancing esthetic considerations against economic ones. Without such a component, you don't even have a choice!
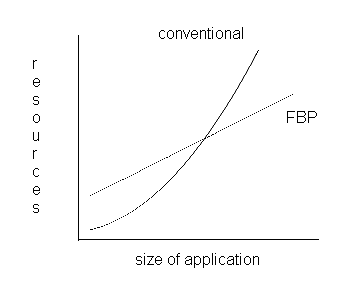
A component like the Report Generator can be added to your application incrementally - that is, you first get your application working with a simple line-by-line printer component, then replace that with the report generation component to produce a good-looking report. Although you are introducing more function into your application, you can predict very accurately how much time it is going to take to do this. In conventional programming, many writers have commented on the exponential relationship between size of application and resources to develop it. This graph typically has the following shape:
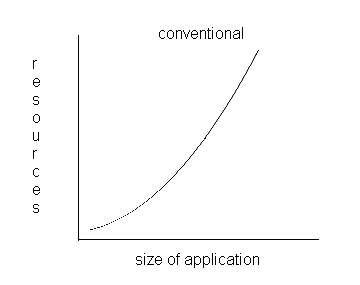
Figure 10.9
Development using FBP shows an essentially linear relationship, as follows:

Figure 10.10
Superimposing the two graphs (even if we allow for the possibility that start-up costs may be slightly higher - in FBP you tend to do more design work up front), we get the following picture:
Figure 10.11
Clearly at some point (and we have found this to occur even with surprisingly small applications), FBP's productivity starts to overtake that of control flow, and in fact gets better the larger the application. FBP scales up! My colleague Chuck (he of the 200-process application) didn't have to worry that his application was going to become harder and harder to debug as it got bigger - he just built it methodically, step by step - and it has since had one of the lowest error rates of any application in the shop. Finally, in case you think that this only worked because he was a single individual who could hold it all in his head, ask yourselves what are the requirements for successfully managing a big project. Surely, some of the more important ones are exactly what FBP provides so well: a consistent view, clean interfaces and components with well-defined functions.
